
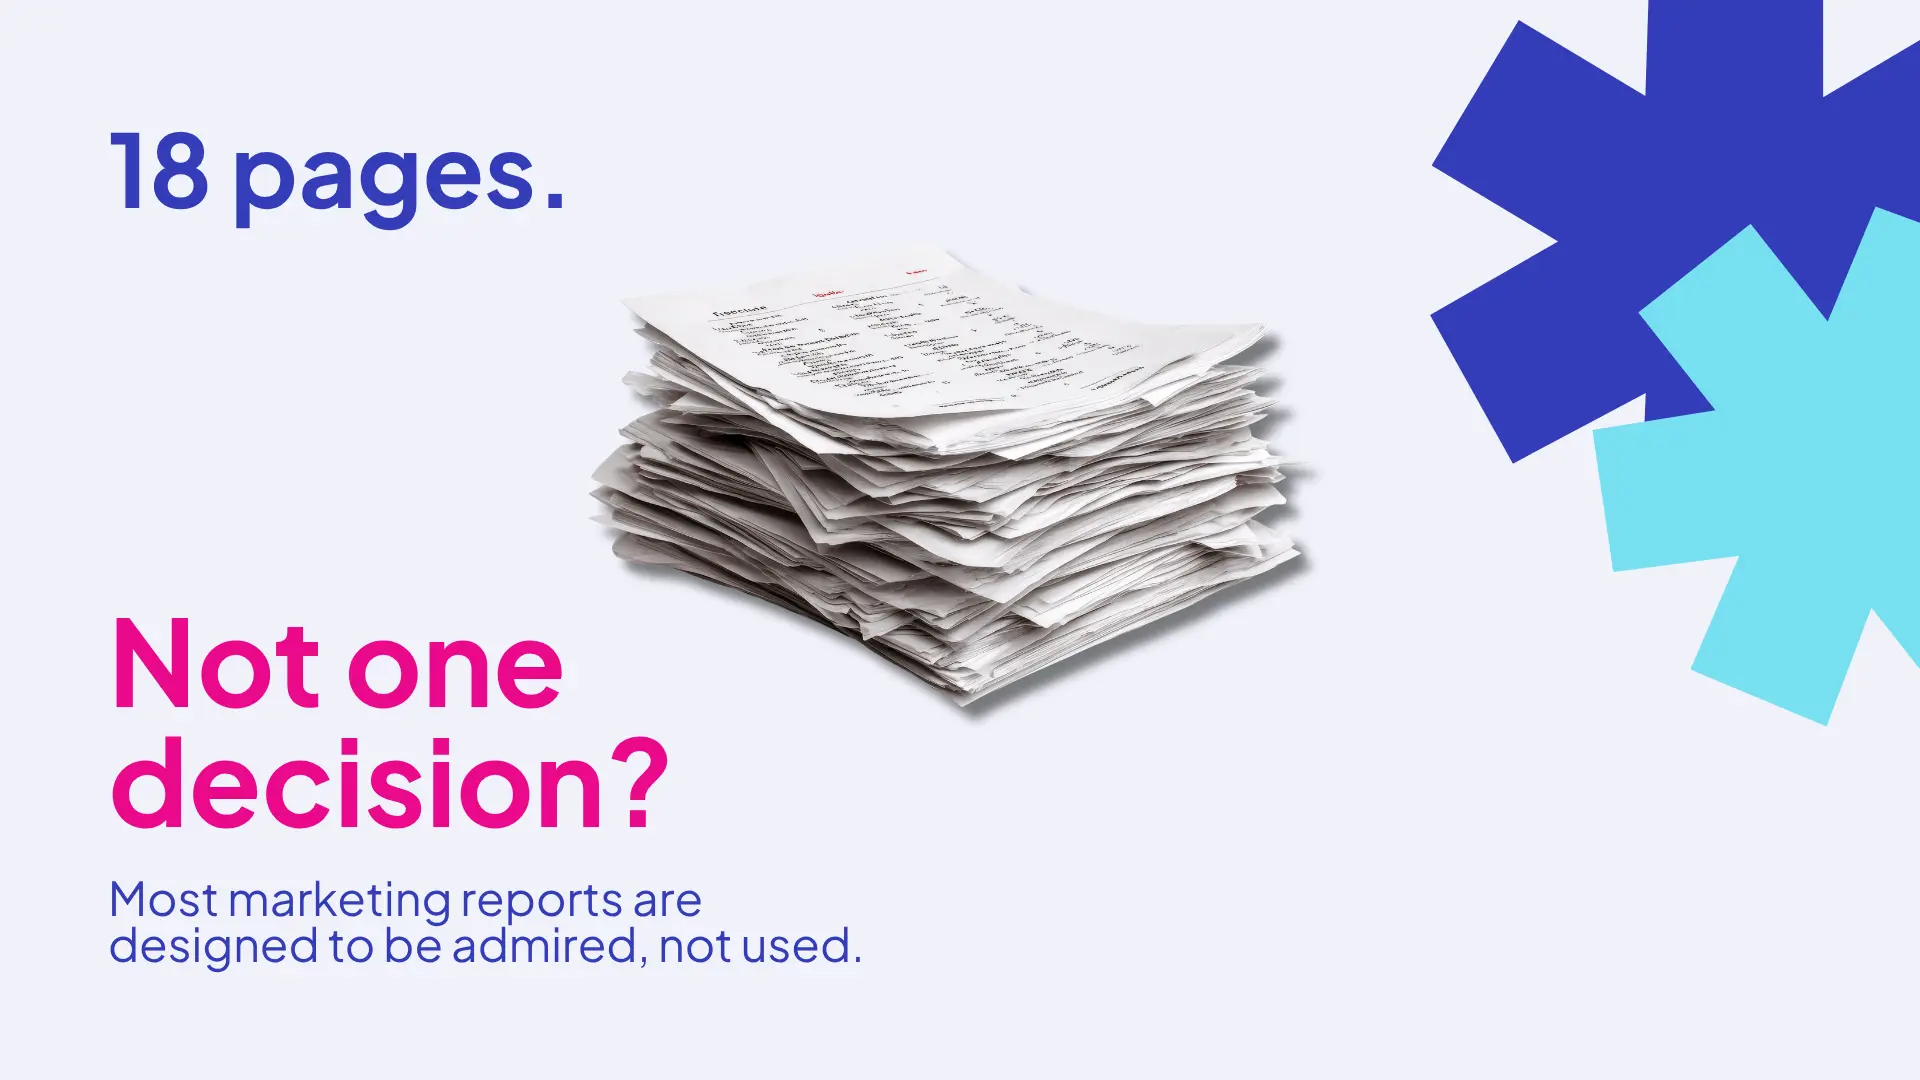
A client forwarded us her monthly agency report and asked what she was supposed to do with it. Eighteen pages. Reach up 34 percent. Engagement up 12 percent. Follower growth steady. A word cloud. Nice charts. She had been receiving one every month for two years and had never once made a decision off the back of it.
That is not a reporting problem. That is a report designed to be admired rather than used. And it is the norm across this industry, because a report full of movement is much easier to produce than a report that says whether the money worked.
Here is how to read one properly.
Start at the bottom, not the top
Find the number that connects to revenue. Enquiries, bookings, quote requests, sales, whatever the buying action is in your business. If that number is not on the page, everything above it is decoration. Reach and impressions tell you how many people had the chance to see something. They do not tell you whether anyone did anything about it. A report can show every input rising while the only output that matters sits flat, and a chart of rising reach will happily distract you from that for a very long time.
Then find the cost of a result
Not what you spent, but what each result cost you. Divide the spend by the enquiries and you have a cost per enquiry. Track it month to month and you can see immediately whether the work is getting sharper or just busier. Most reports never do this calculation for you, and the reason is uncomfortable. It is the single fastest way to see whether the retainer is earning out.
Check the numbers are compared to something
A percentage on its own is not information. Up 34 percent from what, over what period, against what target. If last month was quiet, this month will look extraordinary. Any report showing only the current period, with no same period last year comparison and no target, is telling you a story rather than giving you data.
The five questions to take to your next reporting meeting
- How many enquiries did marketing generate this month, and what did each one cost?
- How does that compare to the same month last year, and to what we agreed as a target?
- Which single campaign worked hardest, and what are we doing with that?
- Which one underperformed, and what are we changing?
- Which channel from our strategy is missing from this report, and why?
If those questions cannot be answered in the meeting without someone going away to pull more data, the report is not doing its job.
Watch what quietly disappears
Reports get edited over time to feature whatever is currently going well. If a metric was celebrated in month three and had vanished by month six, something happened to it. If a channel appeared in your strategy but never in your reporting, ask why. What is missing usually tells you more than what is on the page.
The honest version of a report is often shorter and less flattering. Ours run to a page or two. Some months they say a campaign underperformed and here is what we are changing. That is more useful to a business owner than eighteen pages of things going up, because it gives you something to decide.
If you have a report sitting in your inbox you have never quite known how to challenge, send us the last one. We will tell you what it is showing you, what it is skipping, and the three questions to take back to whoever wrote it. No pitch and no obligation. You are paying for that report either way. You may as well know what it says.
